
In the first part of our series on Auction Theory, we discussed the perspective of value through the lens of profiles. We explained why and how market value is formed and how we can identify the previous value area (Prior Value Area – PVA). In today’s second part, we will move from theoretical examples of buying and selling cars to practical examples, specifically focusing on the American S&P 500 index. We will also look at another way to identify value along with the so-called Developing Value Area (DVA).
Volume-Weighted Average Price (VWAP)
As the name suggests, VWAP is an indicator that measures the average price weighted by trading volume. Let’s return to the example with the used car dealership. If on a particular trading day in the used car market there were 100 transactions, with 50 transactions occurring at a price of €900 and 50 transactions occurring at a price of €1100, the VWAP would be €1000. However, let’s imagine that 99 transactions occurred at a price of €1100 and only 1 transaction occurred at a price of €900. The candlestick chart would look exactly the same. However, the VWAP would be €1098 because the price of €1100 has a weight of 99 transactions while the price of €900 has a weight of only one transaction. Thus, VWAP indicates the average price at which transactions were executed during a specific period. This calculation is significantly different from standard moving averages because it takes into account the actual behavior of traders in the market, not just the average price for a given period.
So, looking back at the principle of profiles, we can logically deduce that the so-called “fair price” represented by the Point of Control (POC) in TPO (Time Price Opportunity) displays can be replaced by the VWAP value. Subsequently, we use the same procedure as with profiles – we calculate 1 standard deviation around the “fair price,” and we obtain a value area (Chart No. 1).
Chart No.1
ESM23; VWAP – Session Anchor, hlc3; 5m; Heikin Ashi; 27.3.2023
Source: TradingView
Just like with profiles, we distinguish between 2 states that alternate in the market:
- Balance
- Imbalance
In the attached chart, we will highlight the narrative of the day from the perspective of AMT (Chart No. 2).
Chart No.2
ESM23; VWAP – Session Anchor, hlc3; 5m; Heikin Ashi
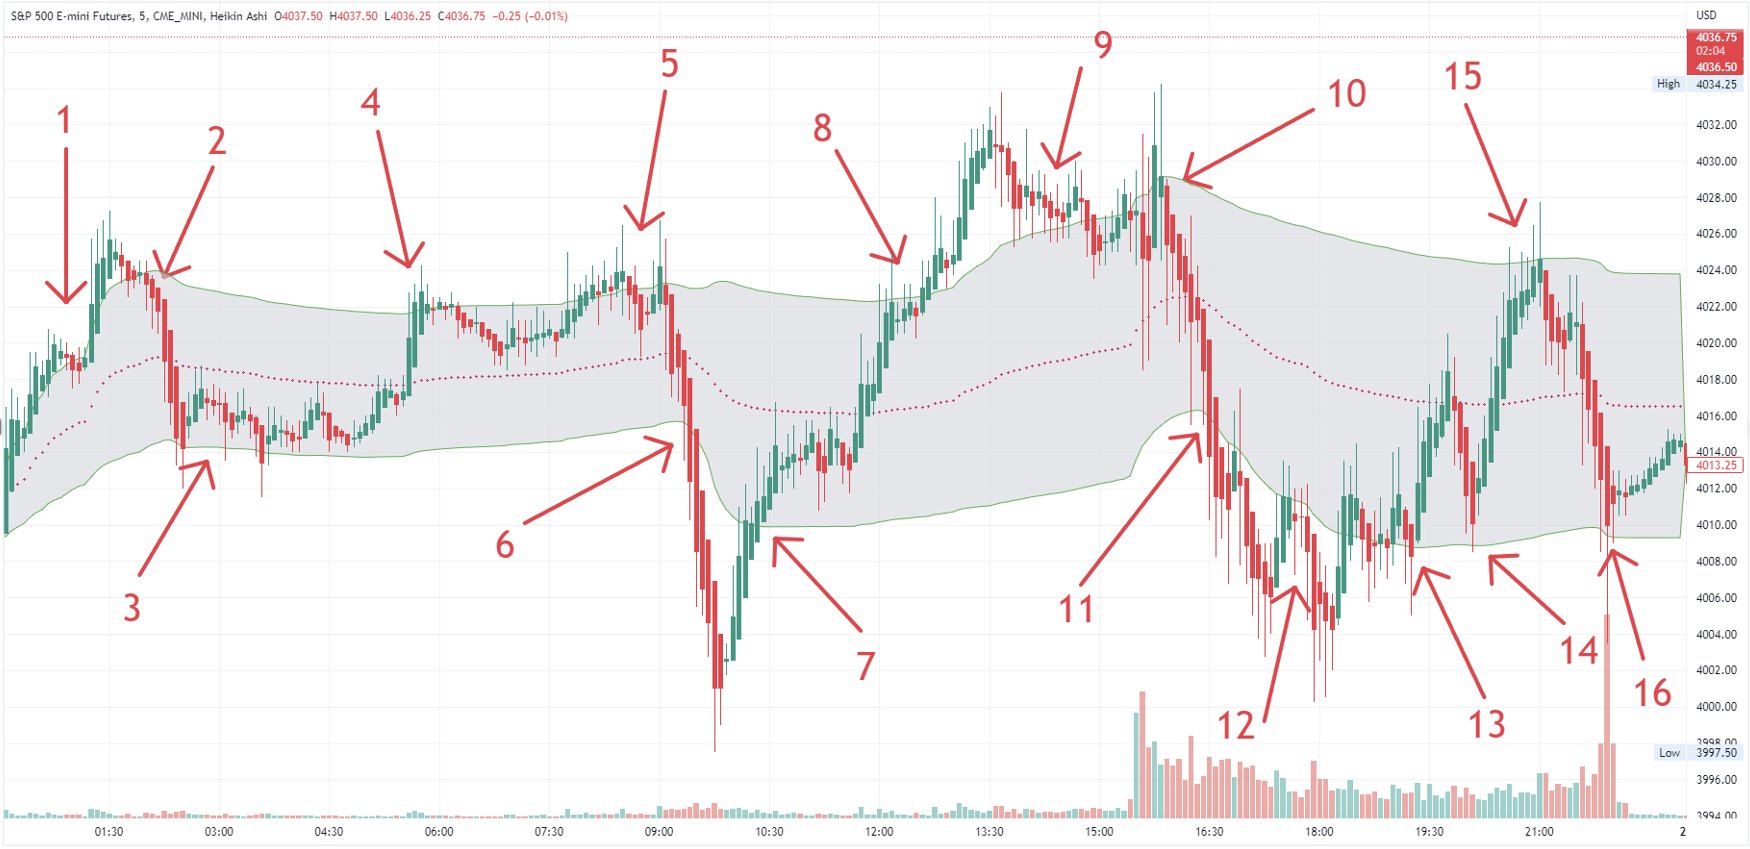
Source: TradingView
1.) DVA has not yet been sufficiently formed due to the small amount of data, but we see an attempt at a bullish imbalance.
2.) The price is returning to equilibrium = traders can accurately estimate the value, but their inventory is too long, and the price is near the upper edge of the value area (Developing Value Area High – DVAH), so rotation occurs across the DVA.
3.) Apart from weak attempts at price decline, the market remains in balance, but the price is close to the lower edge of the value area (Developing Value Area Low – DVAL). Since traders know where the value is in the market, they realize that the current price is advantageous for them to buy.
4, 5.) The Developing Value Area High (DVAH) continues to hold the price – we remain balanced.
6.) 20 minutes after the opening of the London session, the price moves into a downward imbalance. In the current analysis, we are not concerned with the reasons why this event is happening; we focus on identifying what is actually happening.
7.) The price again finds its way back to the balanced state. Traders once again correctly estimate the value, the inventory is overdone, and we are near the DVAL = rotation to the opposite edge of the DVA.
8.) The market moves into an upward imbalance.
9.) Buyers are relatively aggressive, unwilling to let the price return to balance = they are attempting to create an upward trend.
10.) The opening of the American session brings volatility, but market participants reject higher prices = the value is currently accepted, so there is rotation across the Developing Value Area.
11.) The price moves into a downward imbalance.
12.) The imbalance is currently being maintained, thus the price continues to decline.
13.) After over 2 hours of imbalance, the price returns to the Developing Value Area (DVA). Balance is once again accepted.
14.) Testing the Developing Value Area Low (DVAL) to see if there is still interest from sellers in returning to the imbalanced state. Balance is accepted, so we can again expect rotation to the opposite end of the DVA.
15.) Test whether buyers are interested in an imbalance. Balance is accepted again.
16.) The last attempt a few minutes before the end of the session to close in a bearish imbalance, also unsuccessful.
The first example highlighted a relatively balanced day. The second example will be the opposite, with a downward trend during the London session and subsequently an upward trend during the American session (Chart No. 3).
Chart No.3
ESM23; VWAP – Session Anchor, hlc3; 5m; Heikin Ashi; 24.3.2023
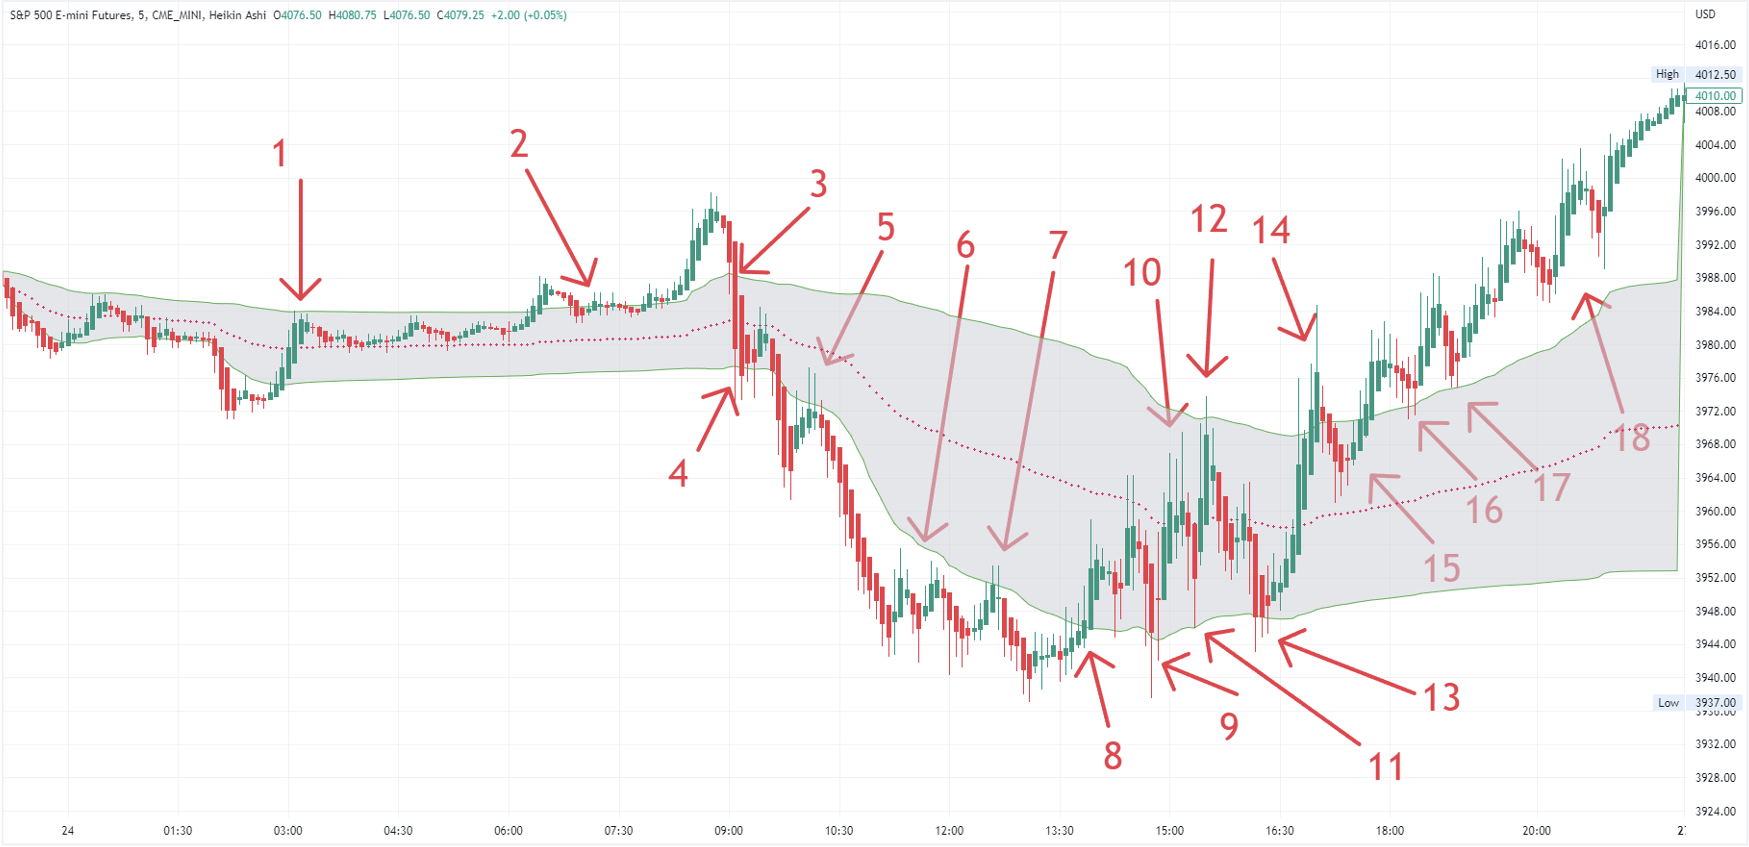
Source: TradingView
1.) After sufficient data, the market enters an equilibrium regime.
2.) The disequilibrium is defended by aggressive buyers, causing prices to rise.
3, 4.) Shortly after the London open, the market reverts back to equilibrium, which is held by DVAL on the first attempt.
5.) Price enters a downward disequilibrium, resulting in a sharp decline.
6, 7.) Buyers still fail to gain the upper hand and the market remains in disequilibrium.
8.) The market returns back to intraday equilibrium after almost 5 hours.
9.) Since the market is in DVAL equilibrium, it means a good price to buy.
10, 11, 12, 13.) Rotation inside the DVA. Since the price is in equilibrium, it is possible to correctly price when the price is high and when it is low.
14.) An attempt by buyers to create a growth imbalance.
15.) The sellers’ latest attempt to maintain equilibrium – unsuccessful.
16, 17.) Upper bound DVA tests confirming participants’ interest in continued rising prices.
18.) Buyers are so aggressive that price doesn’t even have room to drop more than 10 points and immediately the market is bought out.
Summary of important information:
- Using the TPO display, we can identify past levels of value to compare whether market participants’ opinion of price is changing relative to the previous period.
- We use VWAP, which measures the “fair price” since the beginning of the current period, to observe momentary changes in participants’ behavior.
- The inventory is the combined container of the positions of all participants in the auction. If the inventory is too long/short = buyers are oversupplied/undersupplied and we can expect prices to fall/rise due to a return to equilibrium.
- Value area high/low boundaries are frequent levels of competition between buyers and sellers for momentary market dominance.

Author: Ľuboš Polakovič, Hedge Fund Analyst Stonebridge Capital